| 32 of 32 |  |
32
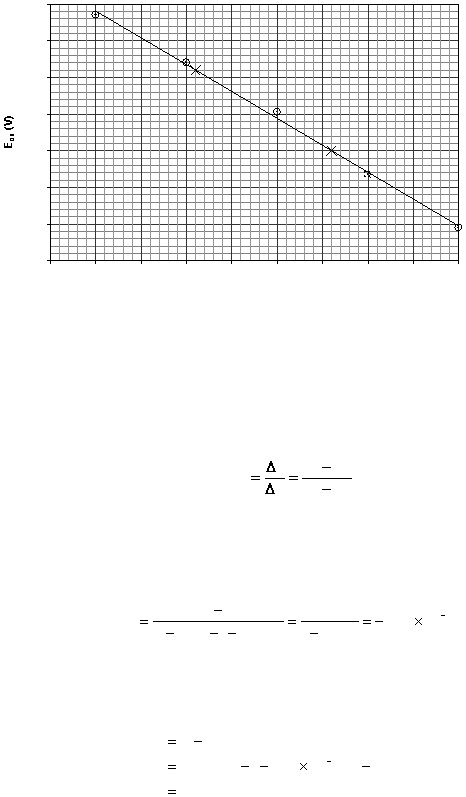
E
ox
vs. log [Cu
2+
]
Point 1
(-2.90, 0.2240)
Point 2
(-1.40, 0.1800)
0.12
0.14
0.16
0.18
0.2
0.22
0.24
0.26
-4.5
-4
-3.5
-3
-2.5
-2
-1.5
-1
-0.5
0
log [Cu
2+
]
For a straight-line graph the relationship between x and y is defined by the following equation:
y = mx + b
where m is the slope of the line and b is the y intercept (the value of y when x = 0). Slope is
defined as rise of the line divided by the run of the line, shown below.
2
1
2
1
x
x
y
y
x
y
m
To determine the slope pick two points on the line, that are easy to read, one from the top half and one
from the bottom half. (These points cannot be data points.) Then substitute into the above equation
including units and magnitude.
V
V
V
V
2
10
93
.
2
50
.
1
0440
.
0
)
40
.
1
(
90
.
2
1800
.
0
2240
.
0
m
The intercept may be found by reading it directly off the graph (provided the x axis started at zero)
or it can be calculated by substituting into the line equation with x and y from one of the above
point and m.
V
V
V
1390
.
0
)
90
.
2
)(
10
93
.
2
(
2240
.
0
2
mx
y
b