G-2
plot such numbers. The pH scale is a more convenient way to represent these extreme changes. Since pH is
a logarithmic relation, when [H3O
+
] changes from 1.0 M to 1.0 x 10
-12
M, the pH changes from 0.00 to 12.00.
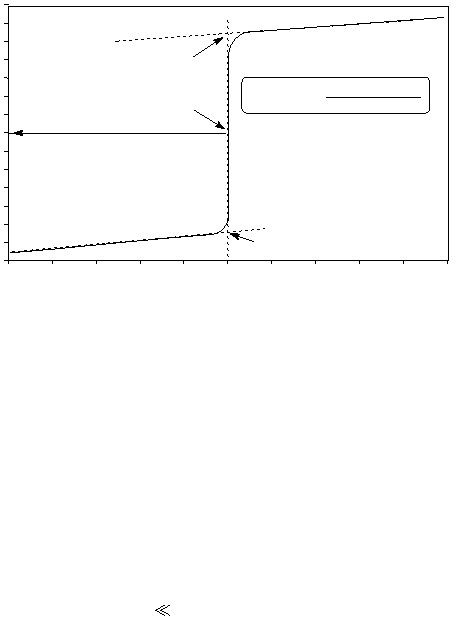
The result of plotting pH values of an acidic solution against volume of base added is called a titration curve.
Figure 1 shows an example of the pH titration curve of a strong acid with a strong base, specifically a solution
of 0.50 M HCl with 0.50 M NaOH .
Figure 1
pH at C + pH
2
Eq. Pt.
D
C
Titration of HCl using 0.50 M NaOH
Volume of NaOH added (mL)
5
40
30
20
10
0
pH
14
12
10
8
6
4
2
0
=
pH at Eq.
Hydrochloric acid is a strong acid that dissociates virtually completely in water. Initially, the concentration of
hydronium ion in this solution will be 0.50 M,
which is equivalent to a pH of 0.30. The value of pH changes
slowly with the addition of NaOH until near the equivalence point. Further addition of NaOH at that point
causes the values of pH to change sharply, resulting in a sharp change in the slope of the titration curve. To
obtain accurate data correlating pH to the volume of base added, it is important to add the titrant dropwise in
this region..
II. Titration of a Weak Acid with a Strong Base.
A chemical equilibrium exists in solutions of weak acids or weak bases. Consider the dissociation of a weak
acid, HA, given below:
HA
(aq)
+ H2O
(l)
H3O
+
(aq)
+ A
-
(aq)
(3)
The base A
-
, formed by reaction of HA with water, is called the conjugate base of HA (the acid HA is the
conjugate acid of A
-
)
. The substances HA and A
-
, are called a conjugate acid-base pair. Titrating a 0.50
M solution of HA with a strong base like sodium hydroxide, and plotting the measured pH against volume of
base added, might give a graph like that shown in Figure 2.
