T-2
that would be energetic enough to form an activated complex. If we compare two otherwise identical
reactions, the rate constant will be smaller for the reaction with the larger E
a
(assuming both reactions
take place at the same temperature).
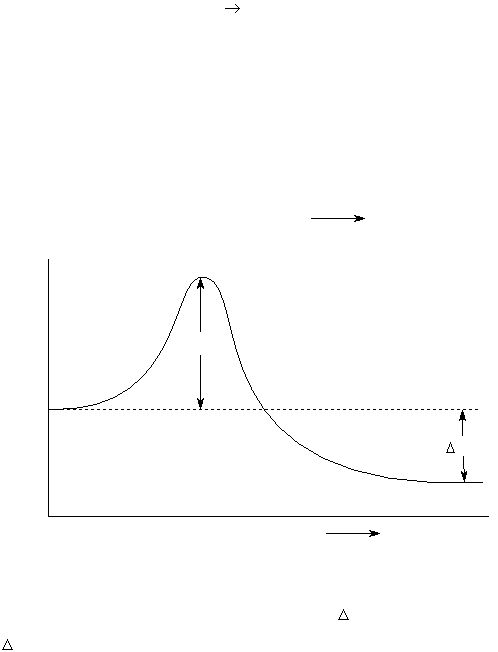
These ideas are illustrated in Figure 1 for the hypothetical elementary reaction:
A + B
C
In this example, molecule “A” reacts with molecule “B” to form molecule “C”. The activated complex
occurs at the peak (where the potential energy is largest). As represented in the diagram, for a reaction
to occur, the molecules A and B must approach each other along the left hand side of the reaction
coordinate, plotted as the abscissa (“x-axis”), with enough translational energy to roll up the hump to the
activated complex at the peak.
FIGURE 1
Potential
Energy
(kJ/mol)
E
a
Reaction Coordinate for A + B
C
Energy Diagram for A + B
C
A + B
C
H
rxn
(reactants)
(products)
The activated complex can undergo further change to form molecule “C”. Most of the activation
energy, E
a
, is redistributed in forming the molecule of C. In Figure 1,
H
rxn
is negative. However, for
some reactions
H
rxn
is positive.
