T-12
Answer ___________________________
REPORT: EXPERIMENT T - ACTIVATION ENERGY
Name ____________________________________
Section ___________ Date ___________________
Laboratory Instructor________________________
1.
Complete Table I on p T-13 as you did in the previous experiment and include it with this report.
(2.0 marks) (Include all the calculations in the spaces provided in the Table or on a separate sheet
if additional space is required.)
What are your units for k? (0.2 marks) _______________________
2.
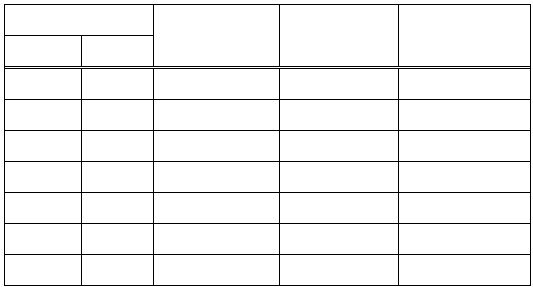
Complete the following table relating the temperature to reaction rate.(0.4 marks)
Temperature
1/T
k
ln k
°C
K
(K
-1
)
(from Table I)
a)
Plot ln k (from Table I) against 1/T(K) on graph paper with a 1.0 mm grid using a
suitable scale. Submit this graph with this report. Make sure that the plot covers
between 60-90% of the graph paper (1.0 mark)
b)
Draw the “best fit” line through the points on the graph. (0.2 marks)
c)
Determine the slope of the line and calculate the value of E
a
. Show calculations (including
units and significant figures) (0.7 marks).
