G-2
This experiment involves the titration of an acid with a base. As the titration proceeds, the hydronium ions,
H3O
+
(aq)
, will be neutralized by the hydroxide ions, OH
-
(aq)
, from the NaOH
(aq)
added to the solution. The
change in concentration of H3O
+
(aq)
during titration will be monitored using a pH meter. The pH of a solution
is a measure of the [H3O
+
] in solution and is defined as
pH = - log [H3O
+
]
(2)
In an acid-base titration, the change in the concentration of H3O
+
may be very large, for example, from 1 M to
1 x 10
-12
M. This represents a trillion-fold change in concentration and it would be quite inconvenient to plot
such numbers. The pH scale is a more convenient way to represent these extreme changes. Since pH is a
logarithmic relation, when [H3O
+
] changes from 1.0 M to 1.0 x 10
-12
M, the pH changes from 0.00 to 12.00.
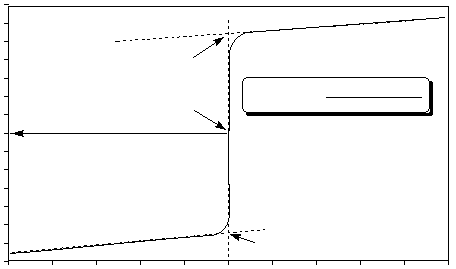
The result of plotting pH values of an acidic solution against volume of base added is called a titration curve.
Figure 1 shows an example of the pH titration curve of a strong acid with a strong base, specifically a solution
of 0.50 M HCl with 0.50 M NaOH .
Figure 1
pH at C + pH at D
2
Eq. Pt.
D
C
Titration of HCl using 0.50 M NaOH
Volume of NaOH added (mL)
5
40
30
20
10
0
pH
14
12
10
8
6
4
2
0
=
pH at Eq. Pt
