 |
Graphing
In many of your experiment you will
use graphs to analyze and interpret your data. In order to
obtain meaningful result you will need
to use a few basic principles, which are described below.
All graphs must be done on 1 mm grid
graph paper found at the back of the manual.
1.
Provide a title at the top of the
page giving enough information so that it is clear what
is being graphed. The title
should state the dependent variable vs. the independent
variable.
2.
Label each axis clearly including
the units and magnitude. The independent variable
(experimentally varied quantity) is
plotted on the x-axis (horizontal axis) and the
dependent variable (measured quantity)
is plotted on the y-axis (vertical axis)
3.
Examine the data to determine the
scale for each axis. Choose a scale such that the
maximum area of the graph paper is
covered and the point are easy to plot (you may
need to rotate the paper 90°).
The scale should also reflect the precision of the data
plotted. For example, if E
ox
is recorded to 3 decimal places you
should be able to plot
it that precicely. Note
that the scale for each axis can be different and they do not
need to start at zero if it is not
convenient
4.
Carefully plot all data points using
small dots in the correct position. The point
should be circled to make them more
visible. (except for pH curves)
5.
Examine the graph. If it appears
to be linear use a ruler to draw a best fit straight line
through as many points a possible
making sure that the points that lie above the line
balance those that are below.
If any points appear to be way off the line neglect them
and mark with a question mark (?).
If the graph is a curve draw a smooth line curve
through all the points.
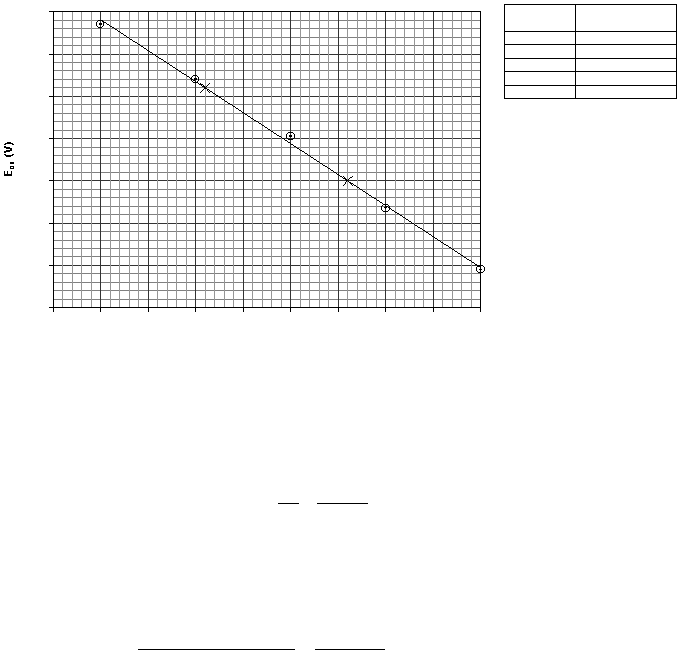
E
ox
vs. log [Cu
2+
]
Point 1
(-2.90, 0.2240)
Point 2
(-1.40, 0.1800)
0.12
0.14
0.16
0.18
0.2
0.22
0.24
0.26
-4.5
-4
-3.5
-3
-2.5
-2
-1.5
-1
-0.5
0
log [Cu
2+
]
For a straight-line graph the relationship
between x and y is defined by the following equation:
y = mx + b
where m is the slope of the
line and b is the y intercept (the value of y when x = 0). Slope
is
defined as rise of the line divided
by the run of the line, shown below.
2
1
2
1
x
x
y
y
x
y
m
-
-
=
D
D
=
To determine the slope pick two points
on the line, that are easy to read, one from the top half
and one from the bottom half.
(These points cannot
be data points.) Then substitute
into the
above equation including units and
magnitude.
V
V
V
V
2
10
93
.
2
50
.
1
0440
.
0
)
40
.
1
(-
90
.
2
1800
.
0
2240
.
0
-
´
-
=
-
=
-
-
-
=
m
The intercept may be found by reading
it directly off the graph (provided the x axis started at
zero) or it can be calculated by
substituting into the line equation with x and y from one of the
above point and m.
V
V
V
1390
.
0
)
90
.
2
)(-
10
93
.
2
(-
2240
.
0
2
=
´
-
=
-
=
-
mx
y
b
prepared by Pollyanna Peters, Lab Instructor, Grant MacEwan
College
Log [Cu
2+
]
E
ox
volts
0
0.138
-1.00
0.167
-2.00
0.201
-3.00
0.228
-4.00
0.254